IBDP>CORE TOPICS> TOPIC 5 ECOLOGY AND EVOLUTION>TOPIC 5.2 GREEN HOUSE EFFECT
Assessment statements
5.2.1 Draw and label a diagram of the carbon cycle to show the processes involved.
5.2.2 Analyse the changes in concentration of atmospheric carbon dioxide using historical records.
5.2.3 Explain the relationship between rises in concentrations of atmospheric carbon dioxide, methane and oxides of nitrogen and the enhanced greenhouse effect.
5.2.4 Outline the precautionary principle
5.2.5 Evaluate the precautionary principle as a justification for strong action in response to the threats posed by the enhanced greenhouse effect.
5.2.6 Outline the consequences of a global temperature rise on arctic ecosystems.
Group activity:
These are some videos on global warming…watch these and create a video of your own.
The group size is 3 students. The video has to be less than 5 mins. The submission is on Thursday 12th Sept 2014. The marks allotted is 10 Rubrics- All points covered- 3 Innovativeness/creativity- 2 Use of own pictures/drawings etc.- 2 including Case studies in the video -3 |
These points should be included in the video
|
|
|
GROUPS-
GROUP 1- KRUTI, DARSHAN, RUCHITA GROUP 2- SANCHIT, TANMAI, PURVA, DARSHI GROUP 3- JIGAR, JNEIL, ANOKHI GROUP 4- KAMAKSHI, NIYATI, SHREETI GROUP 5 BHOOMI, SWARAJ, VINCY GROUP 6 HEET, GOPI, PRACHI Click here for the videos |
|
|
|
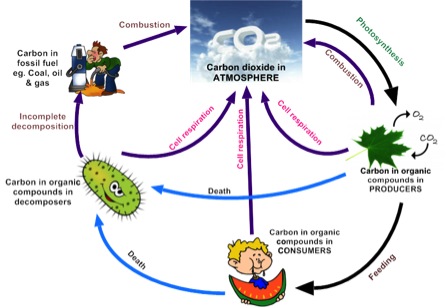
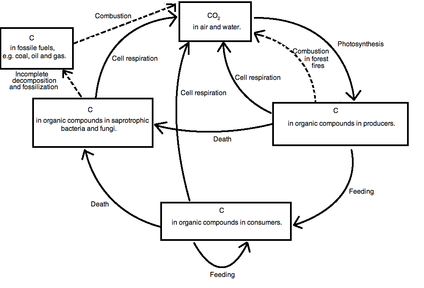
5.2.1 Draw and label a diagram of the carbon cycle to show the processes involved.
|
There are a number of processes by which carbon can be cycled :
Points for drawing the carbon cycleThe following show carbon, which is static within the cycle at this point in time
carbon dioxide in air/water; (sugars/carbon compounds in) plants/producers; (carbon compounds in) animals/consumers; (carbon trapped in) coal/oil/gas/fossil fuels; The following should be show arrows in direction of carbon flow. carbon dioxide absorbed by plants/producers and used in photosynthesis; carbon dioxide released by (cell) respiration in plants/producers; plants/producers eaten by animals/primary consumers/herbivores; primary consumers eaten by secondary consumers; carbon dioxide released by (cell) respiration in animals/consumers; plants/animals die and are decomposed by (saprotrophic) bacteria/fungi; carbon dioxide released by combustion of coal/ oil/ gas/ fossil fuels; carbon dioxide released by (cell) respiration in bacteria/ fungi/ decomposers; forest fires/ combustion releases carbon dioxide from trees/plants; carbon dioxide emitted by volcanoes; |
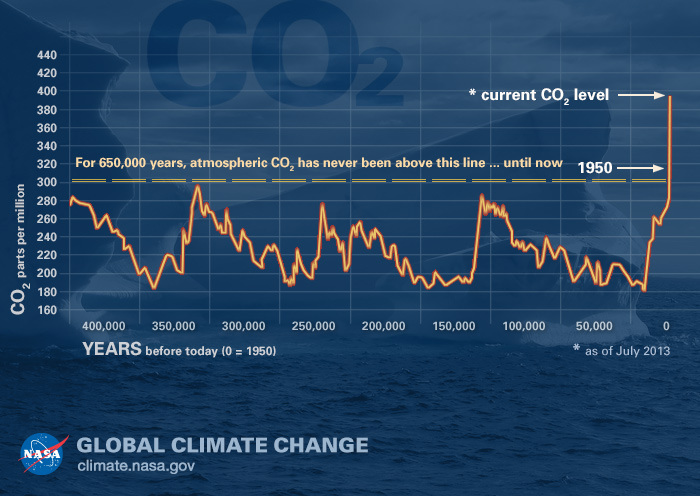
5.2.2 Analyse the changes in concentration of atmospheric carbon dioxide using historical records.
|
Ancient air bubbles trapped in ice enable us to step back in time and see what Earth's atmosphere, and climate, were like in the distant past. They tell us that levels of carbon dioxide (CO2) in the atmosphere are higher than they have been at any time in the past 400,000 years. During ice ages, CO2 levels were around 200 parts per million (ppm), and during the warmer interglacial periods, they hovered around 280 ppm (see fluctuations in the graph). In 2013, CO2 levels surpassed 400 ppm for the first time in recorded history. This recent relentless rise in CO2 shows a remarkably constant relationship with fossil-fuel burning, and can be well accounted for based on the simple premise that about 60 percent of fossil-fuel emissions stay in the air.
If fossil-fuel burning continues at a business-as-usual rate, such that humanity exhausts the reserves over the next few centuries, CO2 will continue to rise to levels of order of 1500 ppm. The atmosphere would then not return to pre-industrial levels even tens of thousands of years into the future. This graph not only conveys the scientific measurements, but it also underscores the fact that humans have a great capacity to change the climate and planet. |
Credit: Data: National Oceanic and Atmospheric Administration. Some description adapted from the Scripps CO2 Program website, "Keeling Curve Lessons."
5.2.3 Explain the relationship between rises in concentrations of atmospheric carbon dioxide, methane and oxides of nitrogen and the enhanced greenhouse effect.
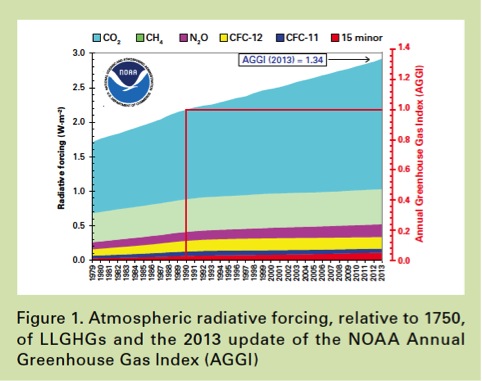
Graph showing the rise in long lived green house gases.(LLGHGs)
source: world meteorological organisation and global atmospheric watch |
The main greenhouse gases are water vapour, carbon dioxide (CO2), methane (CH4) and oxides of nitrogen (e.g. NO2)
The greenhouse effect is a natural process whereby the earth's atmosphere behaves like a greenhouse to create the moderate temperatures to which life on earth has adapted (without the greenhouse effect, temperatures would drop significantly every night. The enhanced greenhouse effect refers to the suggested link between the increase in greenhouse gas emissions by man and changes in global temperatures and climate condition. While these gases occur naturally, man is increasing greenhouse gas emissions via a number of processes, • Deforestation (less trees) • Industrialisation (more combustion) • Increased farming / agriculture (more methane)
|
5.2.4 Outline the precautionary principle
According to the precautionary principle, if the effects of a human-induced change would be very large, then those responsible for the change should take precautionary measures even if there is no scientific consensus regarding cause and effect.
However, this is the reverse of the current situation, those who are concerned about the change would have to prove that it will do harm in order to prevent such changes going ahead.
However, this is the reverse of the current situation, those who are concerned about the change would have to prove that it will do harm in order to prevent such changes going ahead.
5.2.5 Evaluate the precautionary principle as a justification for strong action in response to the threats posed by the enhanced greenhouse effect
There is strong evidence that shows that green house gases are causing global warming. This is very worrying as global warming has so many consequences on ecosystems. If nothing is done, and the green house gases are in fact causing the enhanced green house effect, by the time we realize it, it will probably be too late and result in catastrophic consequences. So even though there is no proof for global warming, the strong evidence suggesting that it is linked with an increase in green house gases is something we can not ignore. Global warming is a global problem. It affects everyone. For these reasons, the precautionary principle should be followed. Anyone supporting the notion that we can continue to emit same amounts or more of the green house gases should have to provide evidence that it will not cause a damaging increase in the green house effect.
5.2.6 Outline the consequences of a global temperature rise on arctic ecosystems.
|
Global warming is an increase in temperature of the Earth;
This may result in climate change / changes in amount of precipitation / greater ranges intemperature; melting ice leads to rising of sea level; Thus leading to loss of habitat. (example of organism that would lose habitat to be given) 1. Algae 2. Polar bears Changes in predator-prey relationships (due to ecosystem disruption); 1. Polar bear and seals Increased success of pest species; 1. Mosquito population has arrived in this region. Temperate species with bigger range of habitats as ice melts; 1. Robins have arrived and other woody shrubs have started growing. Increased rate of decomposition of detritus;- due to increase in temperature the frozen detritus will start thawing and decomposition of this will release more CO2 in the atmosphere. |
|