IBDP>CORE TOPICS> TOPIC 5 ECOLOGY AND EVOLUTION>TOPIC 5.3 POPULATIONS
5.3.1 Outline how population size is affected by natality, immigration, mortality and emigration.
5.3.2 Draw and label a graph showing a sigmoid (S-shaped) population growth curve.
5.3.3 Explain the reasons for the exponential growth phase, the plateau phase and the transitional phase between these two phases.
5.3.4 List three factors that set limits to population increase.
5.3.2 Draw and label a graph showing a sigmoid (S-shaped) population growth curve.
5.3.3 Explain the reasons for the exponential growth phase, the plateau phase and the transitional phase between these two phases.
5.3.4 List three factors that set limits to population increase.
5.3.1 Outline how population size is affected by natality, immigration, mortality and emigration.
Group of individuals of the same species that have the potential to breed with each other.
Natality: increases population size as offspring are added to the population.
Immigration: increases population size as individuals have moved into the area from somewhere else and so this adds to the population.
Mortality: decreases the population as some individuals get eaten, die of old age or get sick.
Emigration: decreases the population as individuals have moved out of the area to go live somewhere else.
|
Explain the reasons for the sizes of animal populations within communities changing and thereasons for them remaining constant. [8M]
Natality / births / reproduction increases populations; as long as natality is higher than mortality; abundant food allows increase / food shortage causes decrease;low level of predation allows increase / high level causes decrease; low level of disease allows increase / high level causes decrease; immigration increases populations; as long as immigration is greater than emigration; population rise until a plateau is reached; carrying capacity of the environment; when the resources of the environment cannot support any more individuals; graph of sigmoid population growth; environmental factor and its consequence (e.g. flood causes decrease); |
Cell division in unicellular organisms can increase the population size. Outline reasons for the population of a unicellular organism not increasing, despite reproduction by cell division. [6M]
Mortality/cell death; emigration; rate of death/mortality equal to or greater than cell division / reproduction; predation / example of predator / macrophage; disease;competition for food / other resources; food running out; accumulation of waste products; change in pH; change in temperature; antibiotics: change in the growth medium;lack of oxygen/carbon dioxide; |
5.3.2 Draw and label a graph showing a sigmoid (S-shaped) population growth curve.
Draw a diagram and explain the shape of population growth curves
Diagram: curve is sigmoid (s-shaped) and labelled with population/size/number on y-axis and time on x-axis; three regions/phases labelled exponential (could include curvature at start), transitional, plateau;
Explanation: exponential region/phase: [2 max] exponential region is where population is growing very rapidly; natality rate exceeds mortality / immigration rate exceeds emigration; food/space/resources at minimum/no limiting factors; transitional region/phase: [2 max] population growing at a slower rate; natality falling/mortality rising / immigration falling/emigration rising; natality rate still higher than mortality; limitations caused by reduced food/space/resources / more disease/more predation begin to take effect; plateau region/phase: [2 max] population size is (more or less) constant / rate of increase is zero; combination of natality and immigration rates balanced by combination of mortality and emigration rates; food/space/resources/diseases/predators are significant limiting factors;
Describe with the aid of a diagram the phases of a sigmoid population growth curve. [4M]
Correct s-shaped curve. Correct labelled diagram for full marks. (exponential) – rapid increase in population;
(transitional) – slowing of growth;
(plateau) – levelling off,
birth rate = death rate; carrying capacity labelled;
Correct s-shaped curve. Correct labelled diagram for full marks. (exponential) – rapid increase in population;
(transitional) – slowing of growth;
(plateau) – levelling off,
birth rate = death rate; carrying capacity labelled;
5.3.3 Explain the reasons for the exponential growth phase, the plateau phase and the transitional phase between these two phases.
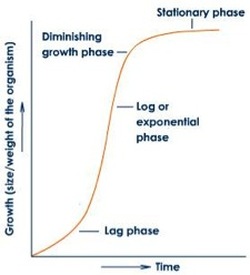
Initially, population growth may be slow, as there is a shortage of reproducing individuals which may be widely dispersed
As numbers increase and reproduction gets underway, three stages of population growth are seen:
Exponential phase:
1. Rapid increase in population growth.
2. Natality rate exceeds mortality rate.
3. Abundant resources available. (food, water, shelter)
4. Diseases and predators are rare.
Traditional phase:
1. Natality rate starts to fall and/or mortality rate starts to rise.
2. There is a decrease in the number of resources.
3. An increase in the number of predators and diseases.
4. Population still increasing but at a slower rate.
Plateau phase:
1. No more population growth, population size is constant.
2. Natality rate is equal to mortality rate.
3. The population has reached the carrying capacity of the environment.
The limited resources and the common predators and diseases keep the population numbers constant.
5.3.4 List three factors that set limits to population increase.
Every species has limits to the environmental conditions it can endure changes in some factors can lead to limitation of population size.
1. Increase in predator and parasites
2. Availability of shelter and water
3. Climatic changes
4. Shortage of food supply
Some of these factors are density-dependent, while others are unrelated to the density of the population.
1. Increase in predator and parasites
2. Availability of shelter and water
3. Climatic changes
4. Shortage of food supply
Some of these factors are density-dependent, while others are unrelated to the density of the population.